Tasman Organics PAMU
Pāmu (Landcorp Farming Limited) is a well-known New Zealand state-owned enterprise which owns 112 farms across the country.
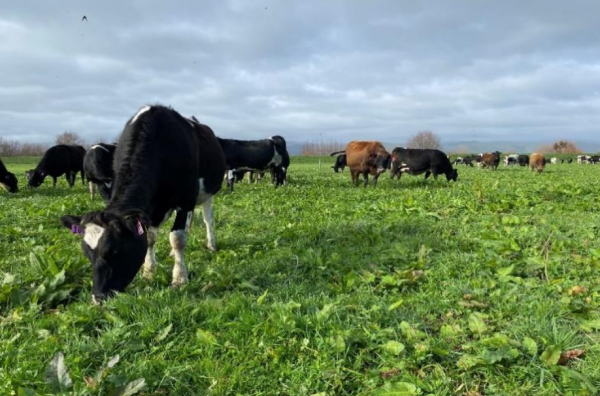
Moutoa is a Pāmu farming complex (seven dairy farms) in the Manawatū region, 20 kilometres inland from Foxton.
Video
Download this story
Download a copy of the Pāmu s story here [PDF, 688 KB]
Overview
Around 30 people are directly involved with the Moutoa operation, making it a big part of the Pāmu team.
Within the Moutoa complex is the Tasman dairy farm. This was established by the amalgamation of two smaller adjoining farms in 2017, giving a total of 155 hectares, with the construction of a single cowshed, now milking up to 344 cows.
Table 1: Historical performance
| Season end | Peak cows | Cows per Ha | kg MS | kg MS/cow |
| 2016 | 232 | 3.2 | 98547 | 424 |
| 2017* | 240 | 1.5 | 98419 | 410 |
| 2018 | 259 | 1.7 | 88504 | 341 |
| 2019 | 274 | 1.8 | 130742 | 333 |
| 2020** | 319 | 2.1 | 139000 | 436 |
| 2021** | 305 | 2.0 | 143375 | 470 |
| 2022*** | 333 | 2.1 | 122157 | 367 |
| 344 | 2.2 | 125226 | 364 |
** In 2020 and 2021 strong spring performance enabled abnormal area in summer forage crops.
*** Flooding in 2022 and 2023 has significantly limited performance.
What changes have been made?
Pāmu operates with the belief that environmentally sound farming practices create the highest quality products. This means environmental considerations are an integral part of all steps in the Pāmu journey – from pasture to plate.
With that background, Pāmu identified that a shift to organic milk supply had the potential to lower the environmental footprint, but the premiums for organic milk would mean no loss in commercial viability.
Pāmu started the conversion of the Tasman dairy farm to a fully organic farm operation in the 2016-2017 season. Initially this came with a significant reduction in cow numbers (halved) until the farm policy and system potential under organic milk supply standards came together.
Pāmu’s policy of organic supply requires each individual farm to be responsible for generating its own feed and providing effluent for fertiliser. A support block was converted to organic production and utilised for young stock grazing from 2018.
By the end of the 2019 season, pasture production and crop yields (20 T/ha of maize and turnips up to 15 T/ha) along with the option to graze young stock off farm, indicated the stocking rate could be lifted from 1.5 to 2.2 cows per hectare. This was still a 31 percent reduction in the original stocking rate.
The Tasman farm now milks 330 spring calved cows, twice a day, on a diet of pasture, summer turnips and/or plantain, along with home grown maize and pasture silage.
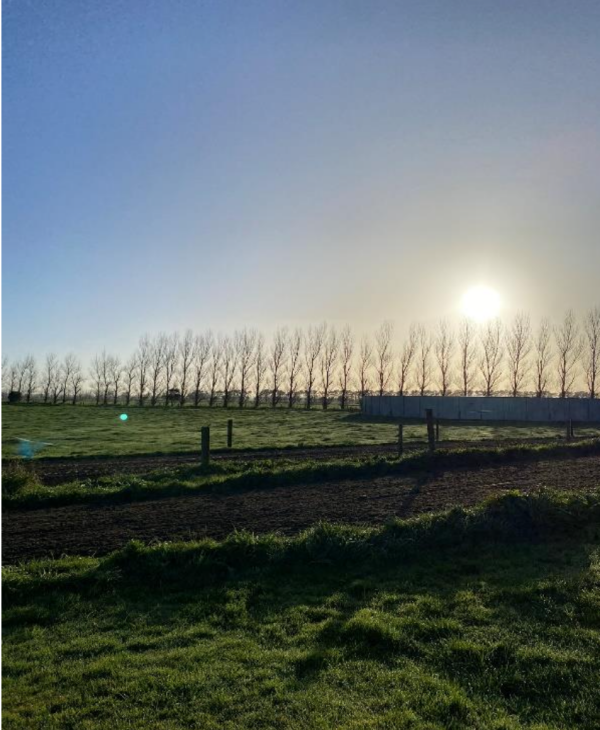
Riparian plantings and shelter belts are being established where possible to protect waterways, for animal welfare reasons, and farm pride. It is part of Pāmu’s vision to “enrich our land, our people and the future of farming.”
Why were the changes made?
To supply certified organic milk to Fonterra, the farm requires a three-year conversion process to meet expected organic market standards (the USA’s National Organic Programme and the Canada Organic Regime have the highest thresholds for entrance).
The organic standards are very clear on the restricted use of the land, animal husbandry and fertiliser inputs. This sets the operation clearly apart from surrounding conventional operations
GHG modelling method
The farm was modelled in Farmax for the eight years being analysed.
What have been the impacts of the changes?
Figure 1: Total biological emissions (methane and nitrous oxide)
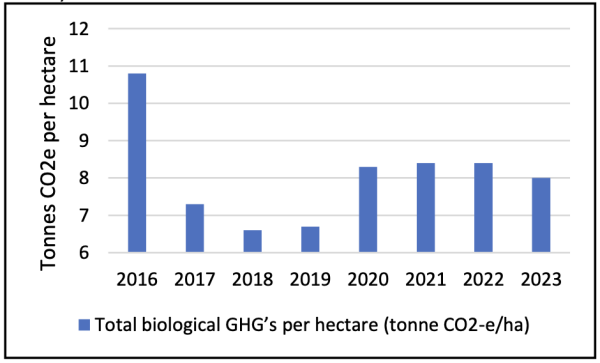
During the period of 2017 to 2019, the farm was converting from conventional to organic milk supply. Greenhouse gas emissions were lower through that period but increased as the farm moved into a stable, fully certified organic supply.
In the 2023 season, the farm had more cows but reduced supplementary feeding from 1.2 t DM/cow in the 21/22 season to 0.7 t DM/cow in the 22/23 season. In turn, this meant culling more cows earlier in the season yet producing similar total milksolids. All of these things reduced GHG emissions.
With the conversion to organic supply now stabilising, the Tasman farm has reduced total emissions by 2.8 T CO2e/ha or 26 percent from the 2015/2016 baseline. See Table 2 at end of this report.
Table 3: Further measures of performance
| 2015/2016 | 2021/22/23 (3-year average) | |
| N feriliser kg/Ha | 179 | nil |
| N loss kg/Ha* | 27 | 16 |
| 6 week in-calf % | 75% | 69% |
| Empty rate | 11% | 13% |
| Farm profit* | $4663 | $4882 |
*N loss per Ha 2015/16 winter cows off-farm but now wintered on-farm.
** Farm profit in 2015/16 is at standardised cost and milk price consistent with current Fonterra payment and organic premiums.
Pāmu’s Tasman farm is delivering similar profitability with 23 percent less GHG emissions and N loss is 20 percent below regional policy requirements.
What process did it go through to make the changes?
Apart from reducing cow numbers, the farm management team and its contractors had to adapt to US and Canadian organic standards regarding animal health and welfare (veterinary and mineral treatment), plant husbandry with organic resources and farm development.
A lower stocking rate demands strong attention to the demand and supply of feed. Deficits cannot be filled in a conventional manner and surpluses must be well managed as these represent either an opportunity to re-build feed inventories and/or establish seasonal forage crops.
As an organic farm in this location, wintering cows off the milking platform is restricted to certified land and not considered financially feasible, so the farm system had to provide for wintering all adult stock on-farm.
What other changes are planned?
Pāmu will look to further improve operational efficiencies on the Tasman dairy farm that will help improve sustainability and reduce emissions further.
This includes:
- reducing wastage of animals through improved mating performance
- managing feed resources better by improving utilisation and reducing winter/spring damage
- enabling pasture positions at the start of the season that provide spring resilience to environmental variability
- improving feed conversion efficiency to capture more production from the same feed inputs
- maintaining 100 percent homegrown feed status for mature cows
- nutrient utilisation and pasture management techniques to grow more feed from the same inputs
- maintaining its focus on people and providing opportunities for learning, development and progression within the farming complex and business, and
- remaining below the Horizons Regional Council target for N loss per hectare, which is 20. Cow housing, feeding infrastructure, and further optimisation of crop areas shows N loss to water could be reduced to 12 per hectare.
What drives or constrains these changes?
- Tasman is prone to flooding which has the immediate effect of reducing available pasture. As proven in recent seasons, in the months following a flood there are further impacts on feed inventories and cropping. Notably, the farm cannot readily replace lost feed in an organic market.
- Retention of skilled people with understanding of organic standards and farm system. Loss of such people will slow environmental progress. Having a tangible focus on team and individuals aims to help retain key people.
What are they doing to ensure climate resilience for the Tasman farm?
- This business is learning how to live with extreme weather events. The farm policy around flood events is a living document containing practices and procedures than minimise damage to farm, animals and people while improving the rate of recovery.
- Pāmu is investigating the use of cow housing. This will provide physical shelter during weather events, reducing stock pressure on farm when soil moisture is high and provides further control of nutrient loss to water, particularly nitrogen.
What advice does Tasman have for other farmers?
- It is possible to reduce the environmental footprint without losing commercial viability.
- The journey towards and outcomes of organic milk supply will not suit all dairy farmers. Pāmu took on this journey for environmental and commercial reasons. Researching the process and standards with grounded consideration of the implications is strongly recommended.
Table 2: Summary of biological GHG emissions and emission intensity
| 2016 | 2017 | 2018 | 2019 | 2020 | 2021 | 2022 | 2023 |
% Change 2023 vs 2016 |
|
|
Methane (T CO2e/ha) |
7.9 | 5.82 | 4.98 | 5.11 | 6.46 | 6.58 | 6.69 | 6.42 | -19% |
|
Methane (kg CH4/ha) |
318 | 233 | 199 | 205 | 258 | 263 | 268 | 257 | -19% |
|
Nitrous oxide (T CO2e/ha) |
2.9 | 1.37 | 1.57 | 1.61 | 1.81 | 1.83 | 1.76 | 1.62 | -44% |
|
Total biological emissions (T CO2e/ha) |
10.8 | 7.29 | 6.55 | 6.72 | 8.27 | 8.41 | 8.44 | 8.04 | -26% |
|
Emission intensity (kg CO2e/kg MS) |
8.0 | 11.3 | 11.3 | 11.3 | 9.1 | 8.9 | 10.4 | 9.8 | 23% |
Published: July 22, 2025