Taumata Farming Partnership, Pukeatua
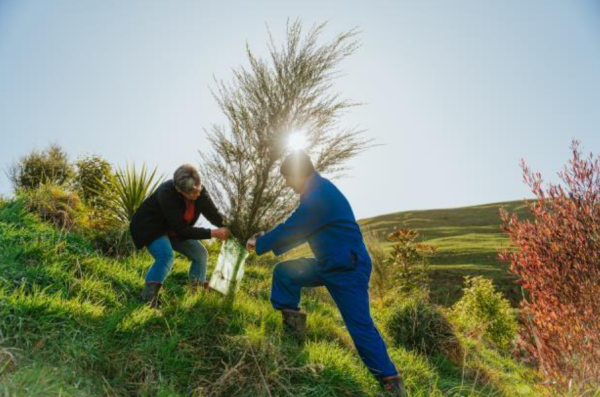
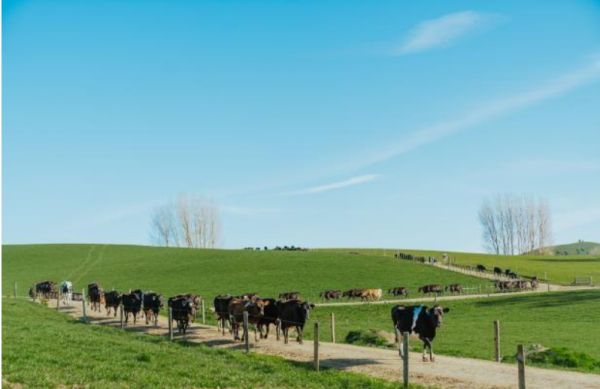
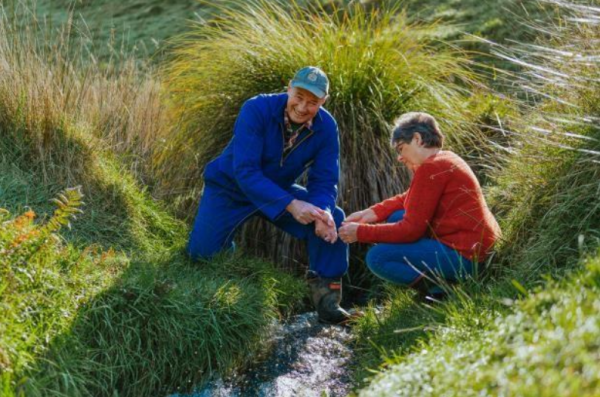
Taumata Farming Partnership Ltd is a family-owned business situated in Pukeatua, approximately 25 km southeast of Hamilton in the Waipā District. Doug and Kathy Wallace purchased the property in 1999, and they have been focused on their environmental impact for many years now.
Video
Download this story
Download a copy of the Kirikiri dairy story here [PDF, 573 KB]
Overview
Originally a dry stock property, since 2017 Doug and Kathy have added adjoining properties and resurrected the former dairy operation that was on the effluent block. Changing back to a dairy farming operation required first land use consent under the Waikato Regional Council Proposed Plan Change One (PPC1) rules. The plan sets out minimum standards that all farms must comply with including stock exclusions, buffer strips and nitrogen applications.
The farm is now a total of 309 ha supporting a 485 dairy herd and replacement heifers, 250 to 300 breeding ewes, plus some beef cattle. The farm has 263 effective ha, plus 10 ha of pine forestry, with the remaining 36 ha in regenerating scrub and native/riparian plantings. The property is characterised by Mairoa ash soils (a well-drained allophanic soil with nearly 50 percent subsoil clay). The farm topography is mixed with approximately 10 percent flat, 36 percent rolling, 21 percent easy hill, and 33 percent steep.
The farm receives approximately 1,300 mm of rainfall per annum with a mean average temperature of 13 degrees Celsius.
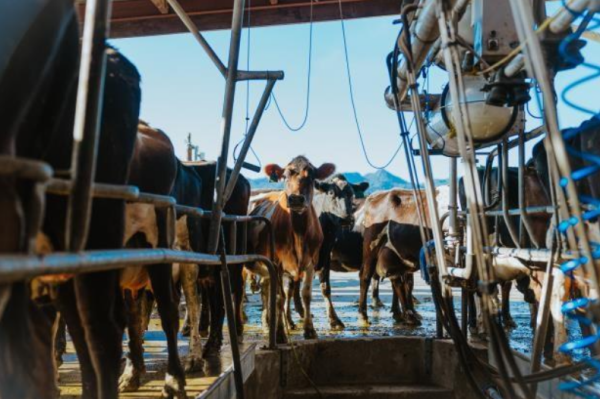
Doug and Kathy operate a system 3 dairy farm, with approximately 18 percent of their feed sourced externally. The dairy farm winters approximately 485 crossbred cows on the flats.
Table 1: Taumata Farming Partnership land areas (ha)
| Enterprise | Land area (ha) |
| Pasture | 263 |
| Forestry | 10 |
| Riparian planting | 36 |
| Total | 309 |
What changes have been made?
Doug and Kathy have undertaken a number of actions on their farm in Pukeatua to improve their
environmental impact. Some of these have helped reduce their methane and nitrous oxide emissions, as well as their overall footprint.
- Reduced stocking rate by 5 percent.
- Amended feed intake, replacing grass silage with maize silage.
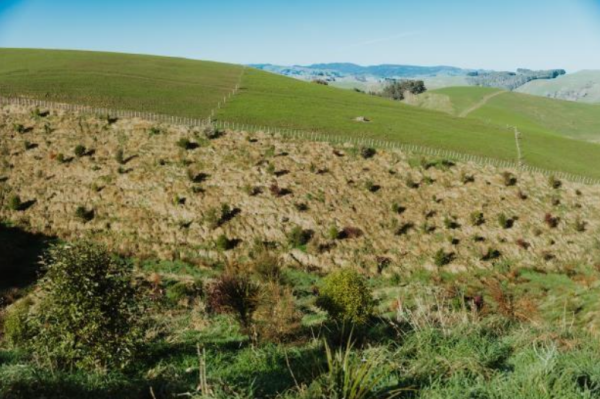
- Continued planting of retired hillsides to protect soils and erosion control (also supports offsetting of emissions).
- Retaining diversified income streams (dairy and sheep).
Table 2: Taumata Farming Partnership physical parameters
|
Physical parameters |
2018 | 2022 |
| Effective ha | 250.6 | 250.6 |
| Peak cows | 480 | 481 |
| Production milk solids/cow | 398 | 354 |
| Total RSU | 6470 | 6173 |
Why were the changes made?
PPC1 is a key part of achieving the Waikato and Waipā river catchment water quality objectives and targets. As part of PPC1, farmers are required to complete a farm environment plan (FEP), a tool used to support farmers and growers to assess their environmental risks and act where required.
Their consent for land use change required the development of a farm environmental plan. The process of developing this plan enabled Doug and Kathy to understand how to diversify their farm system to enhance both local environmental outcomes and their own long-term financial position.
GHG modelling method
The farm was modelled in OverseerFM.
What have been the impacts of the changes?
When Doug and Kathy began making changes on farm, they were focussed on improving environmental outcomes relating to nitrogen and phosphorous. While greenhouse gas emissions were not top of mind, they recently have become more aware of the future requirements for farmers in the face of climate change. Doug and Kathy sought support from a consultant to understand the environmental outcomes of their consented land use change.
Figure 1: Total biological emissions (methane and nitrous oxide) across Taumata on a per ha/yr basis (t CO2e/ha)
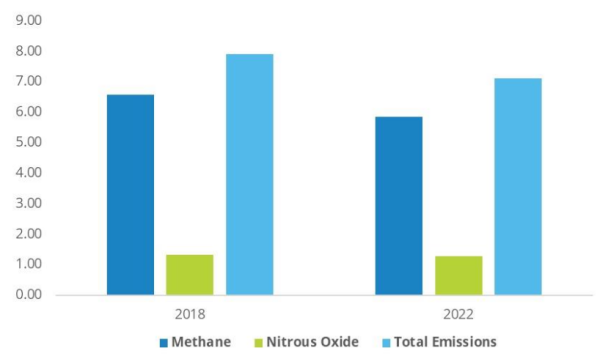
Figure 1 above shows a 10 percent reduction in total biological emissions from 2018/19 to 2022/23. Below in Figure 2, the breakdown of greenhouse gas emissions – methane, nitrous oxide and carbon dioxide is compared.
Figure 2: Total greenhouse gas emissions (t CO2e/ha) from Taumata farm in 2018/19 compared to in 2022/23.
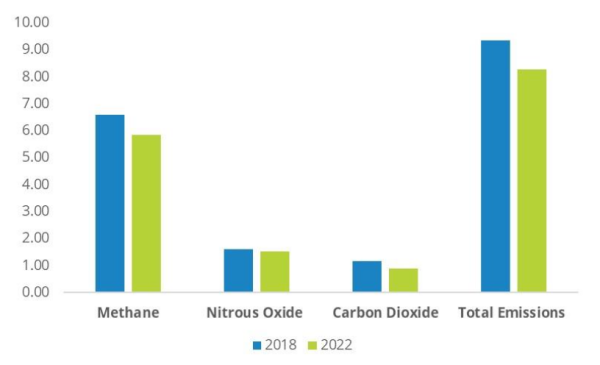
Table 3 demonstrates that Doug and Kathy have reduced their gross emissions by 10 percent from 2018 to 2022.
What process did they go through to make the changes?
Doug and Kathy worked closely with a qualified independent advisor and the Waikato Regional Council to determine the original operation’s nitrogen reference points (NRP) to ensure their new system could safely operate under the NRP for the total nitrogen leached from the farm. The farm planning journey involved assessment of the neighbouring 38.8 ha sheep and beef operation and its conversion to dairy support to be incorporated into Doug and Kathy’s farming operation. The farm plan identified goals and objectives for the operation and set out Doug and Kathy’s environmental obligations under PPC1.
The extended dairy operation made other changes such as reducing its stocking rate on the dairy platform and implementing management policies to improve its extended system operation. The conversion was granted consent in 2017.
What other changes are planned?
Doug and Kathy have not yet determined what other changes they will make for Taumata in future. The couple are continuing to figure out how they can farm better in the face of climate change and nutrient limits on their property.
Doug and Kathy are paying close attention to the changing environmental regulations to ensure that their system remains viable both financially and environmentally.
What drives or constrains these changes?
In the area of the Waikato Region captured by the PPC1 rules from 2016, any land use intensification that involves forestry to pasture, or non-dairy to dairy, has required a rigorous consenting process part of which must prove there will be no increase in contaminant loss from the proposed new farming system.
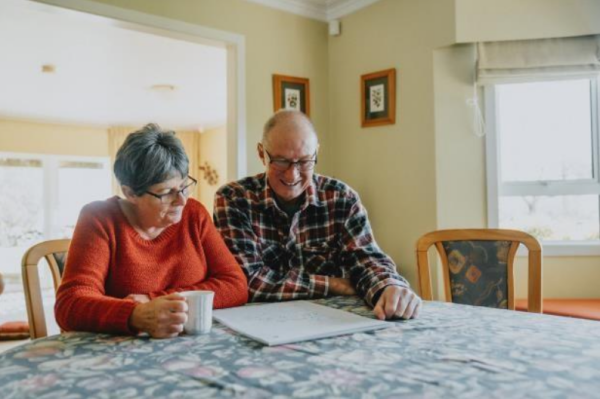
Table 3: Taumata farm emissions from OverseerFM
|
Taumata farm |
2018 | 2022 | % Change |
|
Total area (ha) |
307.5 | 307.5 | |
|
Total Methane (t CO₂e/ha/yr) |
6.59 | 5.85 | -11% |
|
Total Nitrous oxide (t CO₂e/ha/yr) |
1.61 | 1.52 | -6% |
|
Total CO₂e (t/ha) |
1.17 | 0.9 | -23% |
|
Total GHG (t CO₂e/ha/yr) |
9.37 | 8.27 | -12% |
|
Biological Methane (t CO₂e/ha/yr) |
6.59 | 5.85 | -11% |
|
Biological Nitrous oxide (t CO₂e/ha/yr) |
1.31 | 1.27 | -3% |
|
Total biological GHGs (t CO₂e/ha/yr) |
7.90 | 7.11 | -10% |
|
Total Methane (kg CH₄/ha) |
263 | 234 | -11% |
|
Nitrogen leached (kg N/ha/yr) |
27.3 | 22.3 | -18% |
What advice do they have for other farmers?
- It is money well spent to get a professional in environmental compliance to compile and
submit your information to the regulatory bodies. They understand exactly what is required and can guide you on what you need to do to meet your obligations. - Break the actions you need to take on your property into smaller pieces, so it doesn’t
seem so overwhelming. You often can’t physically or financially do everything at once but by prioritising and taking small steps you are working towards the bigger goal. Every little bit helps, and it is better to take small steps than to do nothing. - Remember that your property as well as the overall environment will be impacted by the
actions you take, good or bad. - Take time to step back from work, get off the property and talk with others as well as taking some time to do something you enjoy. You will hopefully come back and look at things through fresh eyes and a renewed enthusiasm.
Published: July 22, 2025